Kernel statistics
Inputting 'k' can get kernel statistics:
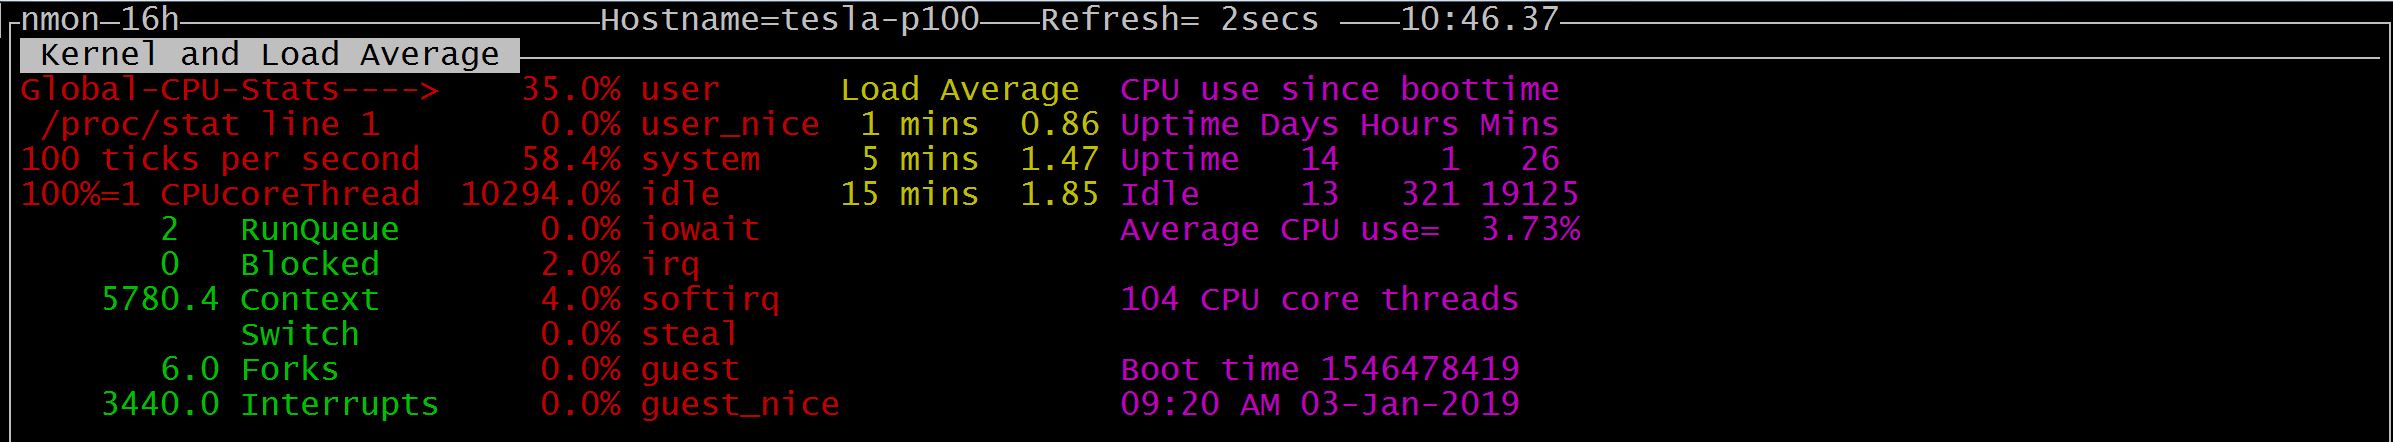
The first "column" (RunQueue, Blocked, etc) is read from /proc/stat file; the second "column" (user, user_nice, etc) is just the first line of /proc/stat (please refer CPU utilization).
The third column (Load average) is read from /proc/loadavg file:
$ cat /proc/loadavg
2.38 1.92 1.83 4/3725 102478
They are the numbers of jobs in the run queue (state R) or waiting for disk I/O (state D) averaged over 1, 5, and 15 minutes.
The fourth column (Uptime related things) is read from /proc/uptime file:
$ cat /proc/uptime
1215709.48 121718010.10
The first field is system boot time while the second one is time spent for idle process (both units are seconds).
The third and fourth columns are processed by proc_kernel() function:
void proc_kernel()
{
    int i;
    p->cpu_total.uptime = 0.0;
    p->cpu_total.idletime = 0.0;
    p->cpu_total.uptime = atof(proc[P_UPTIME].line[0]);
    for (i = 0; i < strlen(proc[P_UPTIME].line[0]); i++) {
        if (proc[P_UPTIME].line[0][i] == ' ') {
            p->cpu_total.idletime = atof(&proc[P_UPTIME].line[0][i + 1]);
            break;
        }
    }

    sscanf(&proc[P_LOADAVG].line[0][0], "%f %f %f",
       &p->cpu_total.mins1, &p->cpu_total.mins5, &p->cpu_total.mins15);
}